How to calculate explained variance ratio in PCA using SVD?
The ultimate goal of my articles is to provide maximum information in minimum time, so if you want to skip to the main content click here
What is PCA?
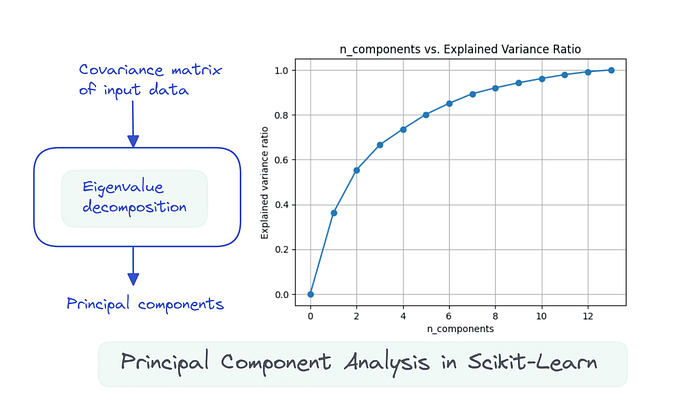
PCA is a dimensionality reduction algorithm that aims to reduces the number of features in dataset. This may help visualize high dimensional datasets, models run faster, aid in feature selection, etc.
The word “may” here suggests that it is not necessary that PCA will always give the best results over its list of benefits.
Important: PCA does not just remove the features from the dataset, rather it identifies a smaller number of uncorrelated variables, that can explain the maximum amount of variance in the original dataset. These variables are called as principal components and they help identifying the most important patterns and relationships in the data.
SVD
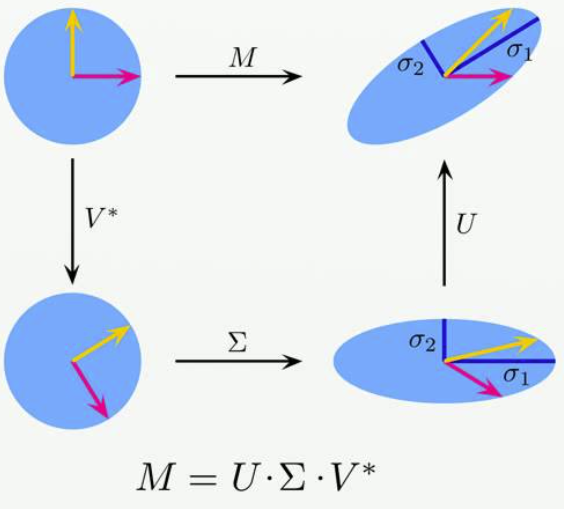
Now, SVD is a matrix factorization technique that can help you decompose your data into the product of three matrices, A = UΣVᵗ, here A represents your data, U and V are orthogonal matrices and Σ is a diagonal matrix of singular values of A (your data).
If you want to know why SVD is performed for PCA or what the relationship between them is — https://stats.stackexchange.com/questions/134282/relationship-between-svd-and-pca-how-to-use-svd-to-perform-pca
What is singular value of A?
The singular value of a matrix A are the square roots of the eigenvalues of the matrix A.T * A (A.T — transpose of A).

Solve this to get the eigenvalues λ₁, λ₂, λ₃, then square root these values to get σ₁, σ₂, and σ₃ which will be singular value of the matrix A.
Why is singular value of A important?
As the main topic of this post is that we need to find explained variance ratio, this value play a significant role for it. This value provides information about the amount of variation in the data represented by each principal component. σ₁ will represent the amount of variation captured by the first principal component, σ₂ for the second principal component, and so on.
How to compute variance using this logic?
import numpy as np

U, S, Vt = np.linalg.svd(X)
variances = S**2 / (X.shape[0]-1)
explained_variances = variances / np.sum(variances)
Important to know!
You need to your data to be centered around the mean. Wanna know why? Stay tuned for my next article.
Conclusion - The explained_variances variable will do the job same as pca.explained_variance_ratio_ when PCA is performed using sklearn.decomposition package.
.
I would like to extend a special thanks to my friend Vaibhav for providing me with valuable insight and inspiration for this post.